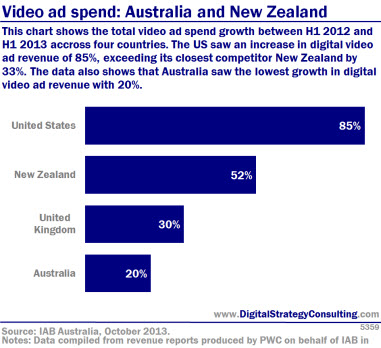
This chart shows the total video ad spend growth between H1 2012 and H1 2013 across four countries. The US saw an increase in digital video ad revenue of 85%, exceeding its closest New Zealand by 33%. the data also shows that Australia saw the lowest growth in digital video ad revenue with 20%. View […]
This chart shows the total video ad spend growth between H1 2012 and H1 2013 across four countries. The US saw an increase in digital video ad revenue of 85%, exceeding its closest New Zealand by 33%. the data also shows that Australia saw the lowest growth in digital video ad revenue with 20%.

