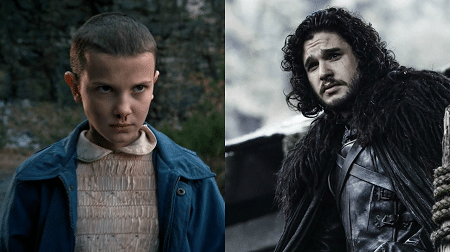
Data analysed by The Trade Desk, reveals unexpected characteristics of fans of the show – and the opportunities for brands to engage with them – ahead the final season’s long anticipated launch next week.
According to the data, Game of Thrones lovers are also more likely to own a games console and follow car racing – by 22 times and 24 times respectively – perhaps unsurprising, given the high-octane nature of the show. But The Trade Desk’s analysis reveals that they are also much more likely to be cat-owners (23 times) and fans of country music (15 times) – highlighting the importance of avoiding stereotypes when identifying audiences for ad campaigns.
Looking further ahead in the TV schedule, The Trade Desk’s data reveals that viewers of sci-fi series Stranger Things are 38 times more likely to enjoy cycling – likely inspired by the monster-fighting stars on their eighties-style push bikes. They’re also 25 times more likely to own a dog and 22 times more likely to be B2B decision makers, making them an unexpectedly lucrative audience for office suppliers, for example.
Fans of historical drama The Crown are 17 times more likely to work in sales and 20 times more likely to spend a lot on corporate gifts than the general population – suggesting they have potential to be big spenders. They’re also 13 times more likely to order takeaway delivery food, with pizza a favourite choice (26 times more likely).
By contrast, those who tune into Peaky Blinders make healthier decisions, with the analysis suggesting fans of the crime drama show are 27 times more likely to be a vegan or vegetarian, 20 times more likely to purchase organic produce, and 31 times more likely to enjoy extreme sports. This might be to counter the time spent sat at desks, as these viewers are 37 times more likely work in finance or insurance – revealing spend to be won by financial software providers, amongst others.
Meanwhile, rather like the characters in the show, fans of darkly comedic Big Little Lies have some surprising hobbies – being more likely to enjoy fixing up computers (61 times), boating (36 times) and riding motorcycles (16 times) than the general population.
Commenting on the analysis, Anna Forbes, General Manager UK at The Trade Desk, said: “Brands may not be able to advertise on Netflix or HBO, but they can – and should – use insights like these to engage with the right audiences across other digital channels. After all, from royal-loving salespeople to fitness fanatic crime drama devotees, our findings reveal just how important it for brands to use data to inform accurate targeting – or risk missing out on valuable, unexpected audiences.
But it’s not just about having access to reams of data. Without the right tools in place to analyse and derive actionable insights from it, advertisers will simply be data drunk – and it’s value will be diminished.”
Here are some of the surprising insights that The Trade Desk found about the world’s TV fans. Compared to the general population:
Game Of Thrones
- 24 x more likely to be interested in car racing
- 23 x more likely to be cat owners
- 22 x more likely to own a games console
- 20 x more likely to be learning Chinese
- 19 x more likely to be an entrepreneur
- 15 x more likely to be country music fans
- 12 x more likely to be a fan of Asian cuisine
Stranger Things
- 38 x more likely to enjoy playing sports outdoors
- 38 x more likely to enjoy cycling
- 25 x more likely to be dog owners
- 22 x more likely to be a B2B decision makers
- 20 x more likely to watch talk shows
- 14 x more likely to enjoy celebrity news and gossip
The Crown
- 35 x more interested in landscape gardening
- 29 x more likely to be focused on their career
- 26 x more likely to enjoy a pizza
- 20 x more likely to spend a lot on corporate gifts
- 17 x more likely to work in sales
- 13 x more likely to order takeout delivery food
- 11 x more likely to be active users of LinkedIn
Peaky Blinders
- 48 x more likely to be interested in fitness
- 37 x more likely to work in finance or insurance
- 31 x more likely to enjoy extreme sports
- 27 x more likely to be a vegan or vegetarian
- 20 x more likely to want to buy organic or ethically sourced produce
- 16 x more likely to watch premier league football
- 13 x more likely to be interesting in dieting and weight loss
Big Little Lies
- 72 x more likely to be interesting in gardening and landscaping
- 61 x more likely to purchase computer repair parts
- 43 x more likely to be interested in the military
- 36 x more likely to be into boating
- 16 x more likely to be a motorcycle enthusiast
- 11 x more likely to buy pre-packed cookies or candy
The Trade Desk used cookie data to build a custom pool of users who frequently view sites that relate to five TV shows – Game of Thrones, Peaky Blinders, Big Little Lies, Stranger Things and The Crown. Analysis of this cookie pool data revealed additional insights such as location, device and other sites viewed.
From here, The Trade Desk calculated relevance scores showing how many times more likely these individual characteristics are to appear in the cookie pool compared to the general population
It also delved into behavioural insights, using third party data to identify additional data segments that the users fall into – for example, gender, age, holiday preferences, and income brackets – and calculate how relevant those segments are for the overall cookie pool compared to the general population
