The UK leads the way in driving website traffic through social engagement, averaging 4.6% compared to other European countries, according to new research.

The findings, from Adobe’s Europe Best of the Best 2015 Report, provides insight into how brands should use the web and social media to enhance customer experience.
The latest report, based on Adobe Marketing Cloud data combined with a survey related to the online habits of over 5,000 consumers across Europe, has found that, compared to other European countries, UK brands drove the most consumers to their websites through social media, with an average website traffic rate of 4.6% in 2015.
With an average of 0.54, German brands drive the lowest amount of traffic to websites, followed closely by French (0.69%).
Other key findings across the region include:
How countries are engaging with brands on social:
• Swedes were found to be the most ‘socially savvy’, with a third (33%) now using Snapchat to engage with brands, and over half (51%) using Instagram
• Conversely, the UK is leading the way in the use of Twitter (45%), and France is the biggest user of Facebook, with a huge 92% of those surveyed using the channel
Facebook still most widely-used:
• Of the 89% of Europeans who said they use Facebook, an overwhelming majority (90%) said they use it to follow and interact with brands
• Over half (59%) of Instagram users are using the platform to interact with brands and a third (35%) are doing so on Snapchat
• Amongst millennials, over half (55%) of 18-24 year olds and 38% of 25-34 year olds in Europe are using Instagram, and 72% of 18-24 year olds are following or engaging with a brand on it
Media and entertainment industry is the clear winner:
• In terms of driving traffic to sites via social media, the media and entertainment industry has a traffic rate of 7.6% compared to an industry traffic rate of 1% or less in other industries like retail, telecommunications or travel
• 57% of 18-24 year olds and 53% of 25-34 year olds follow music and entertainment brands on social media
• Only 45% of European consumers agree that social media channels are getting better at providing relevant content and ads, according to the research
Compared to other European countries, UK brands drove the most consumers to their websites through social media, with an average website traffic rate of 4.6% in 2015. UK brands outperform the US average (3.7%) by 24%. With an average of 0.54%, German brands drive the lowest amount of traffic to websites, followed closely by French (0.69%).
With usage of Snapchat increasing around the world, Swedes were found to be the most savvy when it comes to engaging with its social content – a third (33%) now use the app, compared to around one fifth in France (22%), the UK (20%) and the Netherlands (17%). Germany had the lowest number of Snapchat users, at 14%. Swedes were also the biggest Instagram fans, with over half (51%) reporting use of the platform. The UK followed with just under a third (31%). Conversely, the UK is leading the way in the use of Twitter (45%), and France is the biggest user of Facebook, with a huge 92% of those surveyed using the channel.
Top social platforms for brand engagement
Facebook continues to be the top social platform for consumer brand engagement. Of the 89% who said they use Facebook, an overwhelming majority (90%) said they use it to follow and interact with brands. However, newer networks are proving to be worthwhile investments for marketers, with over half (59%) of Instagram users using the platform to interact with brands and a third (35%) using Snapchat. Twitter (53%) and Pinterest (42%) also continue to have impact.
Amongst millennials, over half (55%) of 18-24 year olds and 38% of 25-34 year olds in Europe are using Instagram, and 72% of 18-24 year olds are following or engaging with a brand on it. Within the 18-24 age group, Snapchat (53%) is now a close second to Instagram (55%) in terms of users – the highest of any age group.
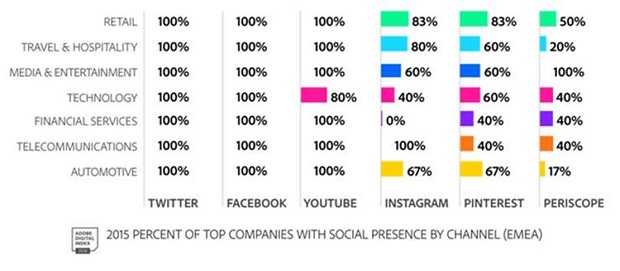
Across industries, all top performing European brands are now present on Twitter and Facebook, with a high percentage of retail, travel and media and entertainment companies also championing the use of YouTube, Instagram, Pinterest and Periscope:

Industries capitalising on social success
The media and entertainment industry is the clear winner for driving traffic to sites via social media, with a traffic rate of 7.6% compared to an industry traffic rate of 1% or less in other industries like retail, telecommunications or travel.
Exploring the type of brands followed by millennials, the survey data showed that 57% of 18-24 year olds and 53% of 25-34 year olds follow music and entertainment brands on social media. Amongst 18-24 year olds, beauty and fashion brands are the second most followed (50%), however news brands are more popular amongst 25-34 year olds (50%).
Social media users slow to engage with content
Despite the huge opportunity for brands to tap into the social experience, social media users are still slow to engage with content: just a third (32%) rated breaking news as the top form of content they engage with, 18% offers and deals, 13% competitions, and only 7% adverts. Only 45% of European consumers agree that social media channels are getting better at providing relevant content and ads, according to the research.
Despite this, targeting by brands is improving. 31% of Europeans said they have noticed that social media posts from brands have been more relevant to them in the past year – nearly half of these (45%) being in the 18-24 age bracket.
Consumers split on the role of advertising
When it comes to social media advertising, users of the various platforms were split, with 34% of those surveyed claiming they get annoyed by adverts from brands they don’t follow, yet a further 33% saying they don’t mind as long as they are relevant. As brands get better at targeting, the business opportunities here are clear, with 1 in 5 participants saying that such targeting has actually introduced them to products they’ve gone on to buy.
Becky Tasker, Managing Analyst, Adobe Digital Insights comments: “As we’ve seen from the data, the leading companies and industries know how important a social platform is as part of a wider digital marketing strategy. However, the challenge now lies in how brands can maximise social engagement and combine it with the overall customer journey. By honing their advertising even more and creating exciting, more personalised content that users want to engage with and share regularly, brands can be assured of greater success, and really take their marketing to the next level.”
Adobe Digital Insights: Best of the Best Methodology
The Best of the Best 2015 report refers to companies using the Adobe Marketing Cloud who rank in the Top 20% of fellow Adobe clients in their industry on various key performance metrics. It is called the Best of the Best because Adobe Marketing Cloud customers are already ahead of the masses through their investment in excellence.
The ADI consists of aggregated and anonymous data from 200 billion visits to 10,000+ U.S. websites, 100 billion visits to 3,000+ websites in Europe, and 100 billion visits to 3,000+ websites in Asia during the 2015 calendar year gathered via Adobe Analytics and Adobe Social. Country averages are based on the industries analysed.
Consumer Research Methodology
Between March 30-April 4 2016, we talked to over 1000 consumers in each of the five EMEA countries (UK, France, Germany, Sweden, and the Netherlands) about what devices they own and how they use these devices throughout their daily activities. We also touched on topics such as social media use and what drives their mobile behaviour, to better understand the trends we see in the Best of the Best data.
