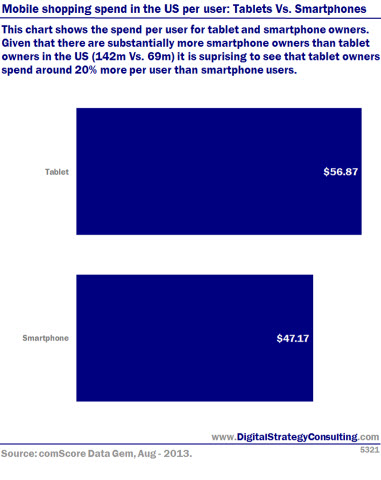
This chart shows the spend per user for tablet and smartphone owners. Given that there are substantially more smartphone owners in the US (142m Vs. 69m) it is surprising to see that tablet owners spend around 20% more per user than smartphone users. View high quality image here
This chart shows the spend per user for tablet and smartphone owners. Given that there are substantially more smartphone owners in the US (142m Vs. 69m) it is surprising to see that tablet owners spend around 20% more per user than smartphone users.

